15 Sep 2023
Deploying frequently improves quality?
Wait, shouldn’t we have good test coverage first?
Let’s explore the paradox.
The art of continuous delivery is full of counter intuitive ideas. These ideas don’t make sense when explained linearly, but do make sense when we look at through the systems dynamics lens.
One of these counter intuitive ideas is the relationship between deployment frequency and quality.
Narrating the Story with Causal Loops

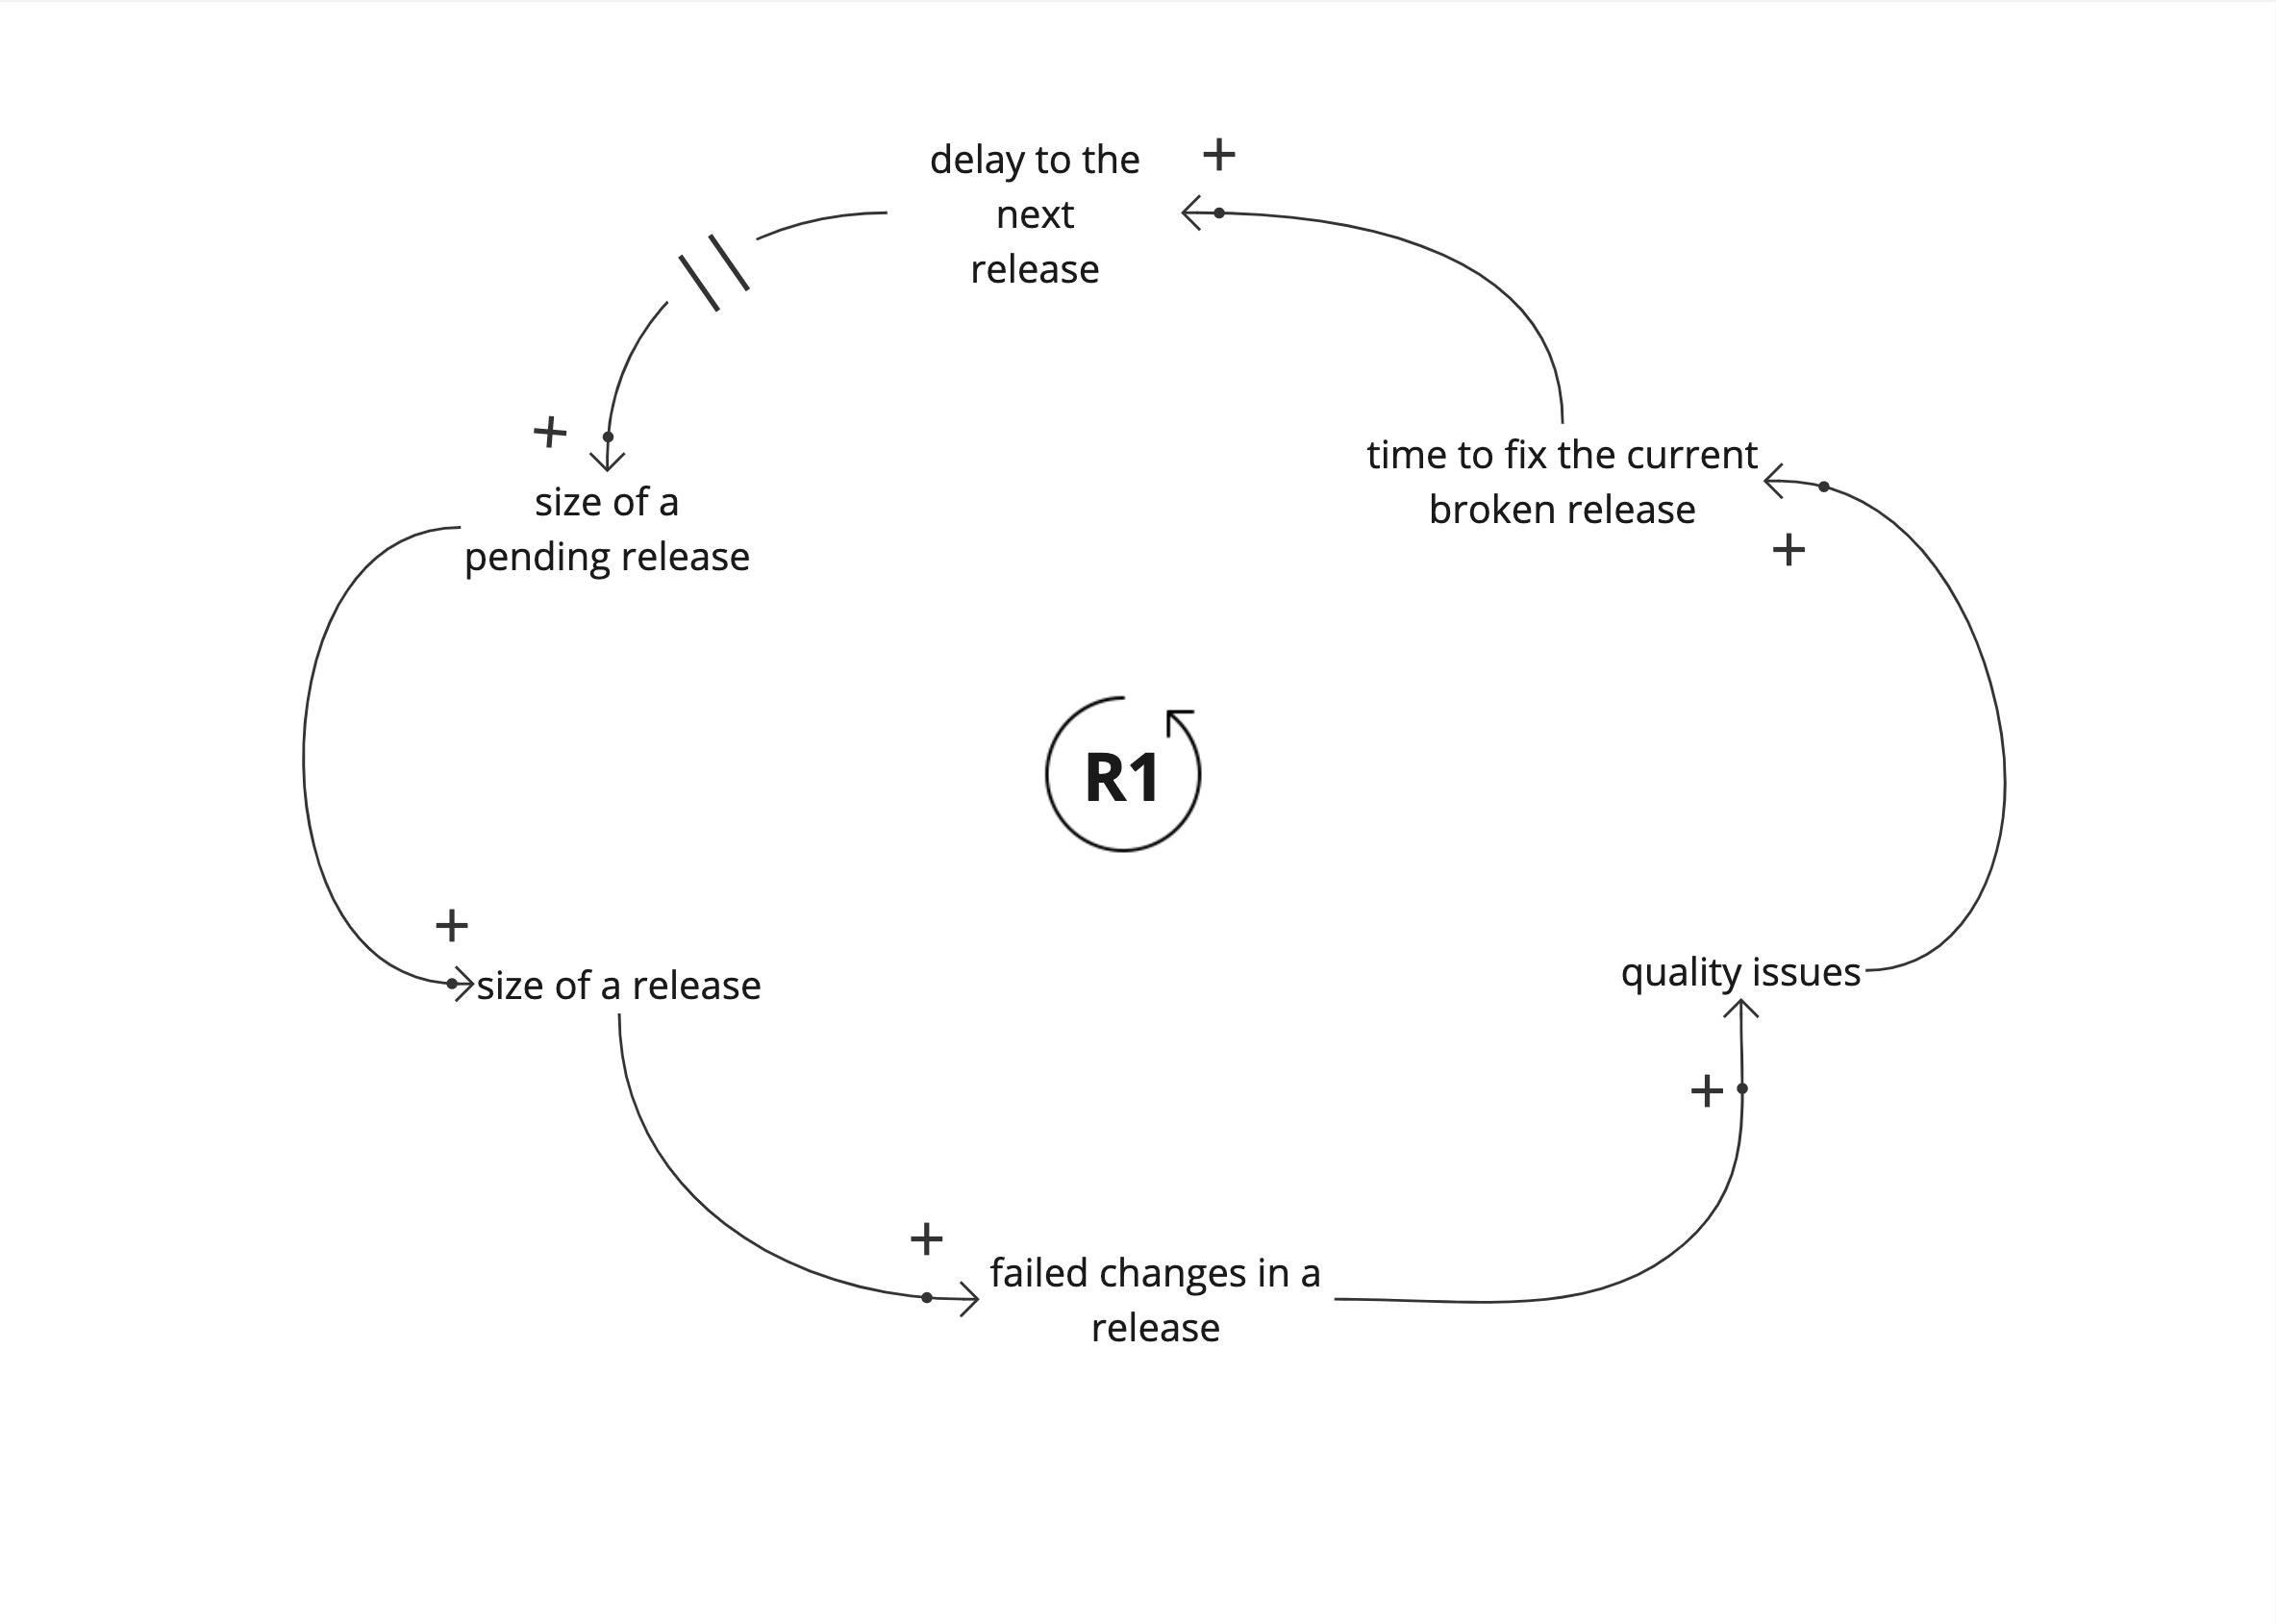
Lets look at the story here using a simple causal loop diagram. This is a common pattern I see in many teams. The contextual details vary between teams.
We start with a large set of changes. Until the set of changes is released to a user in production, we don’t know if it works. Each release is set of changes that could potentially break production.
These failed changes increase quality issues in production. It takes time to fix the issues and fixing them increases the delay to the next release. This delay increases the size of the next release, and increases the amount of potentially failed changes in the future release.
This is a reinforcing loop (R1). A vicious cycle. This leads to worsening product quality.
However, teams struggle through this vicious cycle, and the system doesn’t degrade drastically over time. There are limiting factors that are applied to stop this vicious cycle of worsening quality.
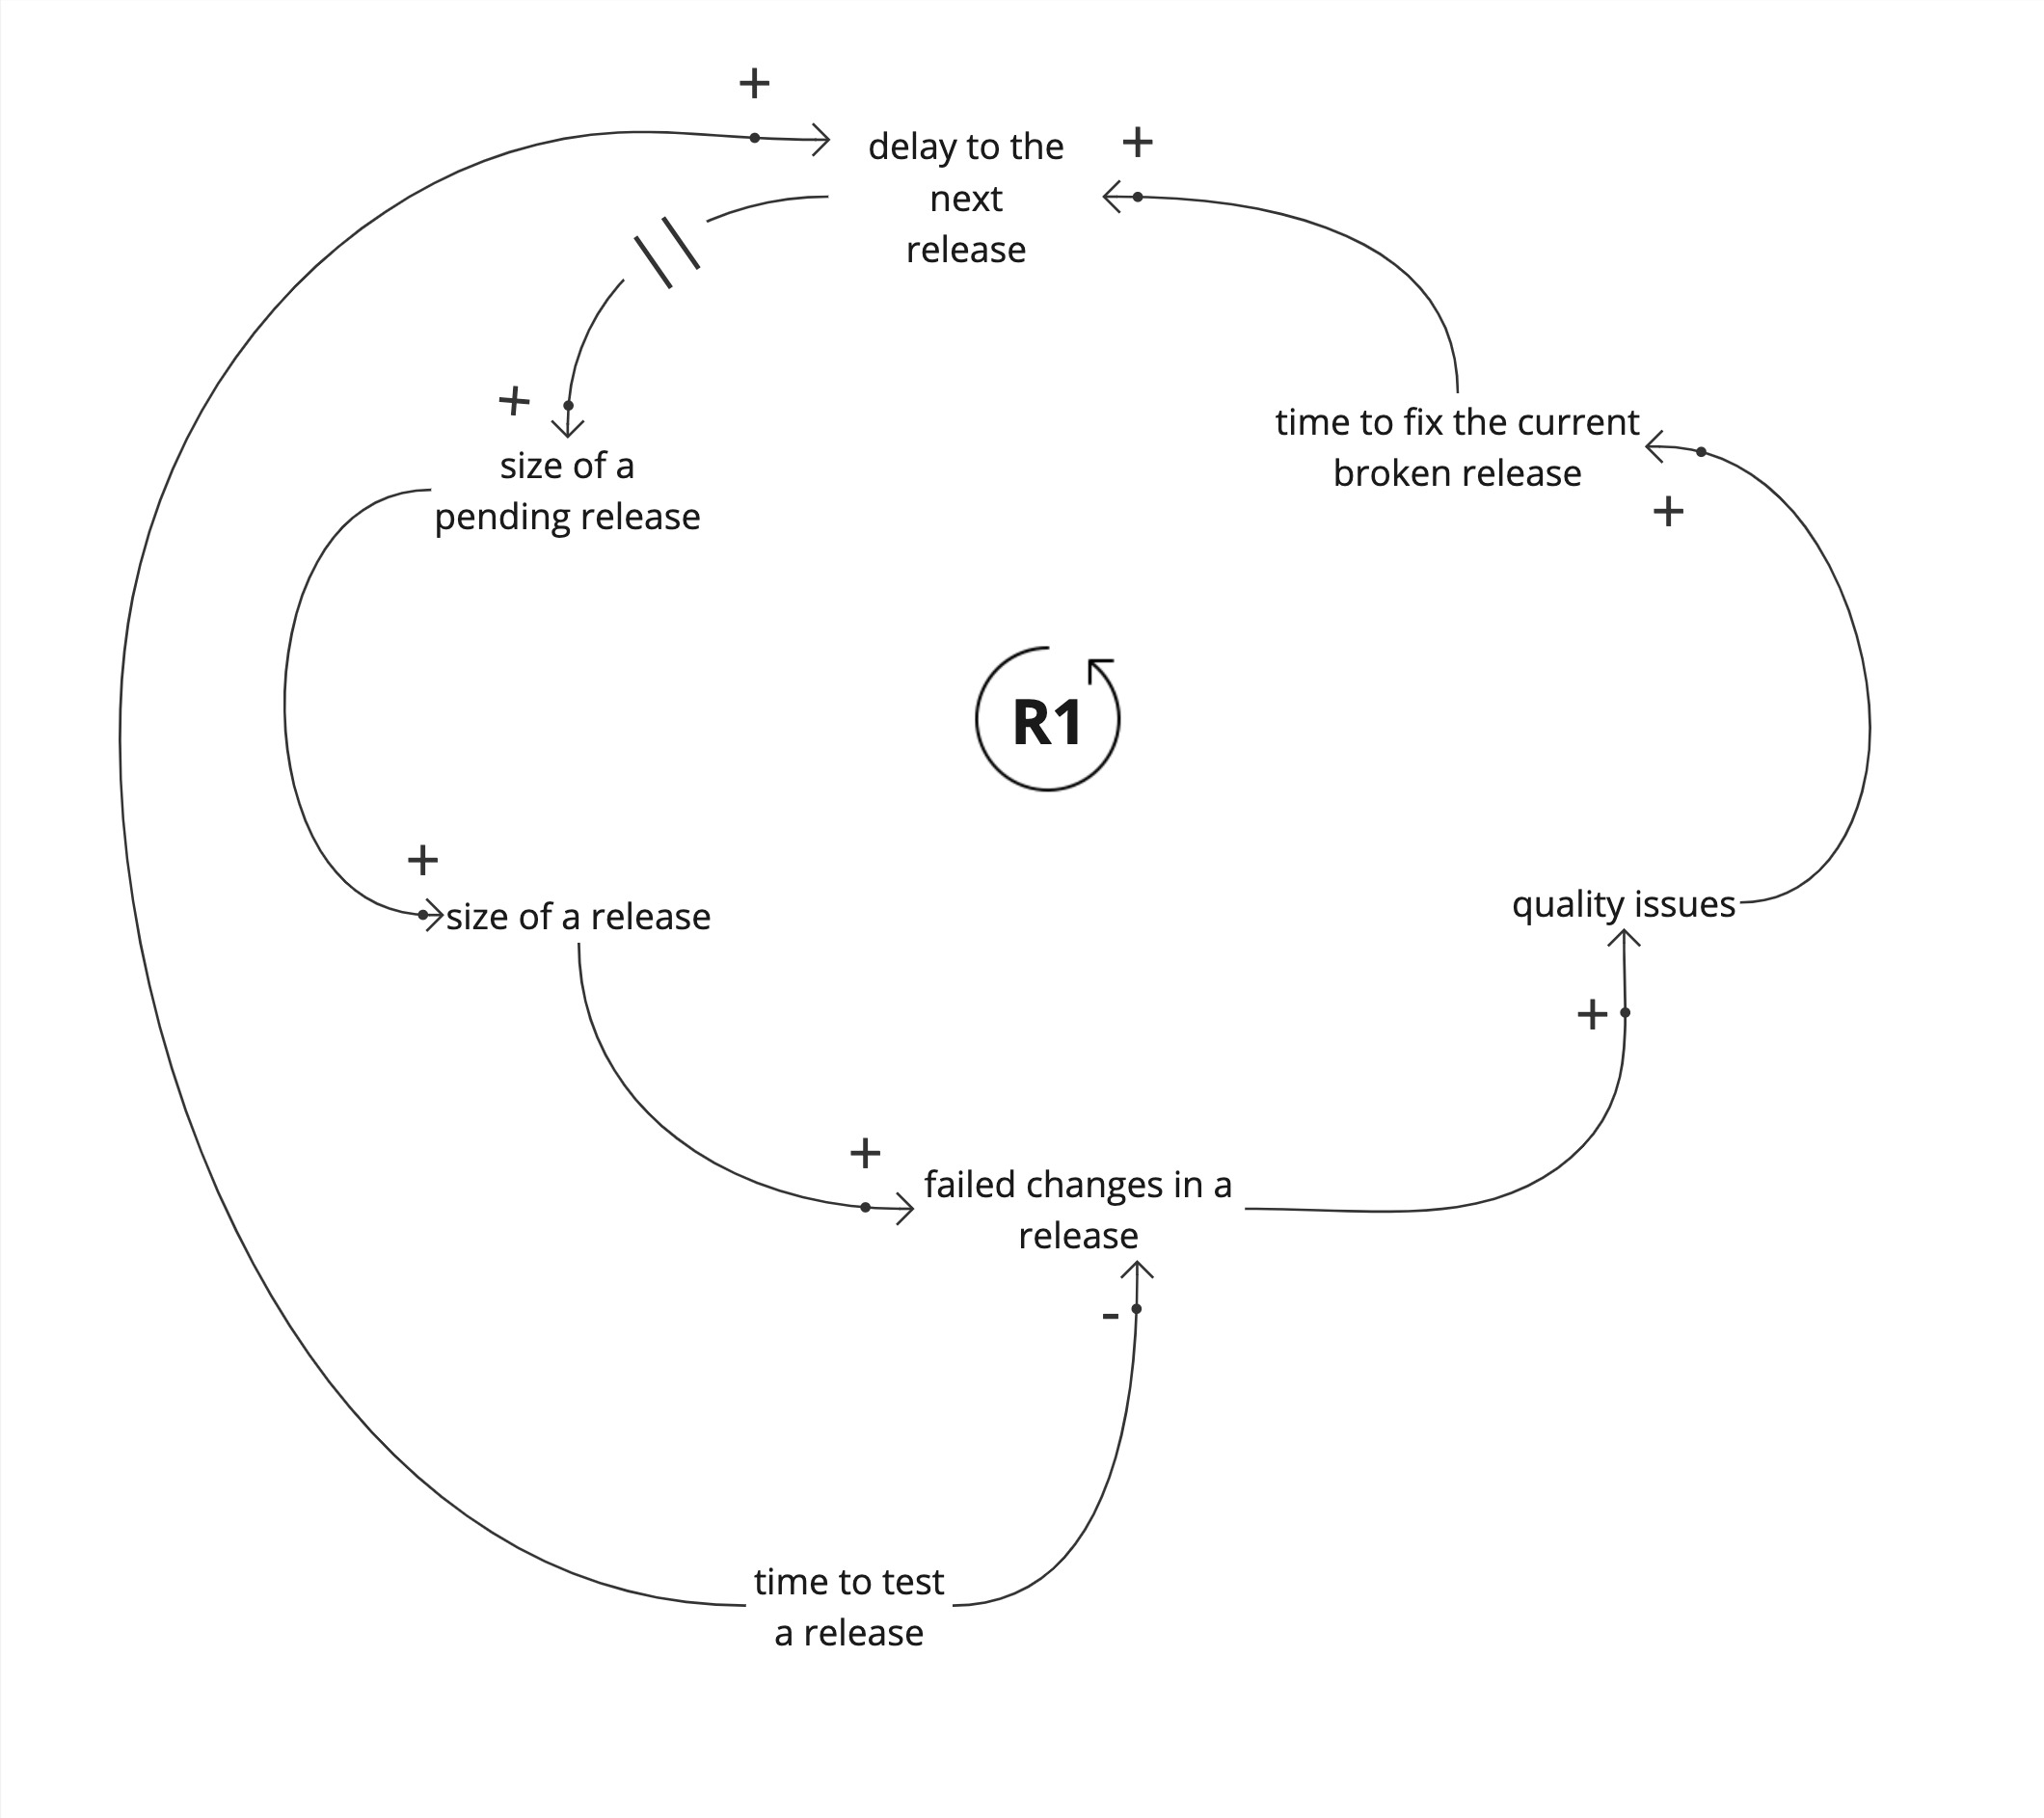
The most common limiting factor is increasing the time to test a release.

This looks like a sane strategy at first. The longer we take to test a pending release, the less likely it will break in production. But this increases the delay to the next release, adding to the amount of changes in the next release. By taking longer to test a release we are inadvertently worsening quality.
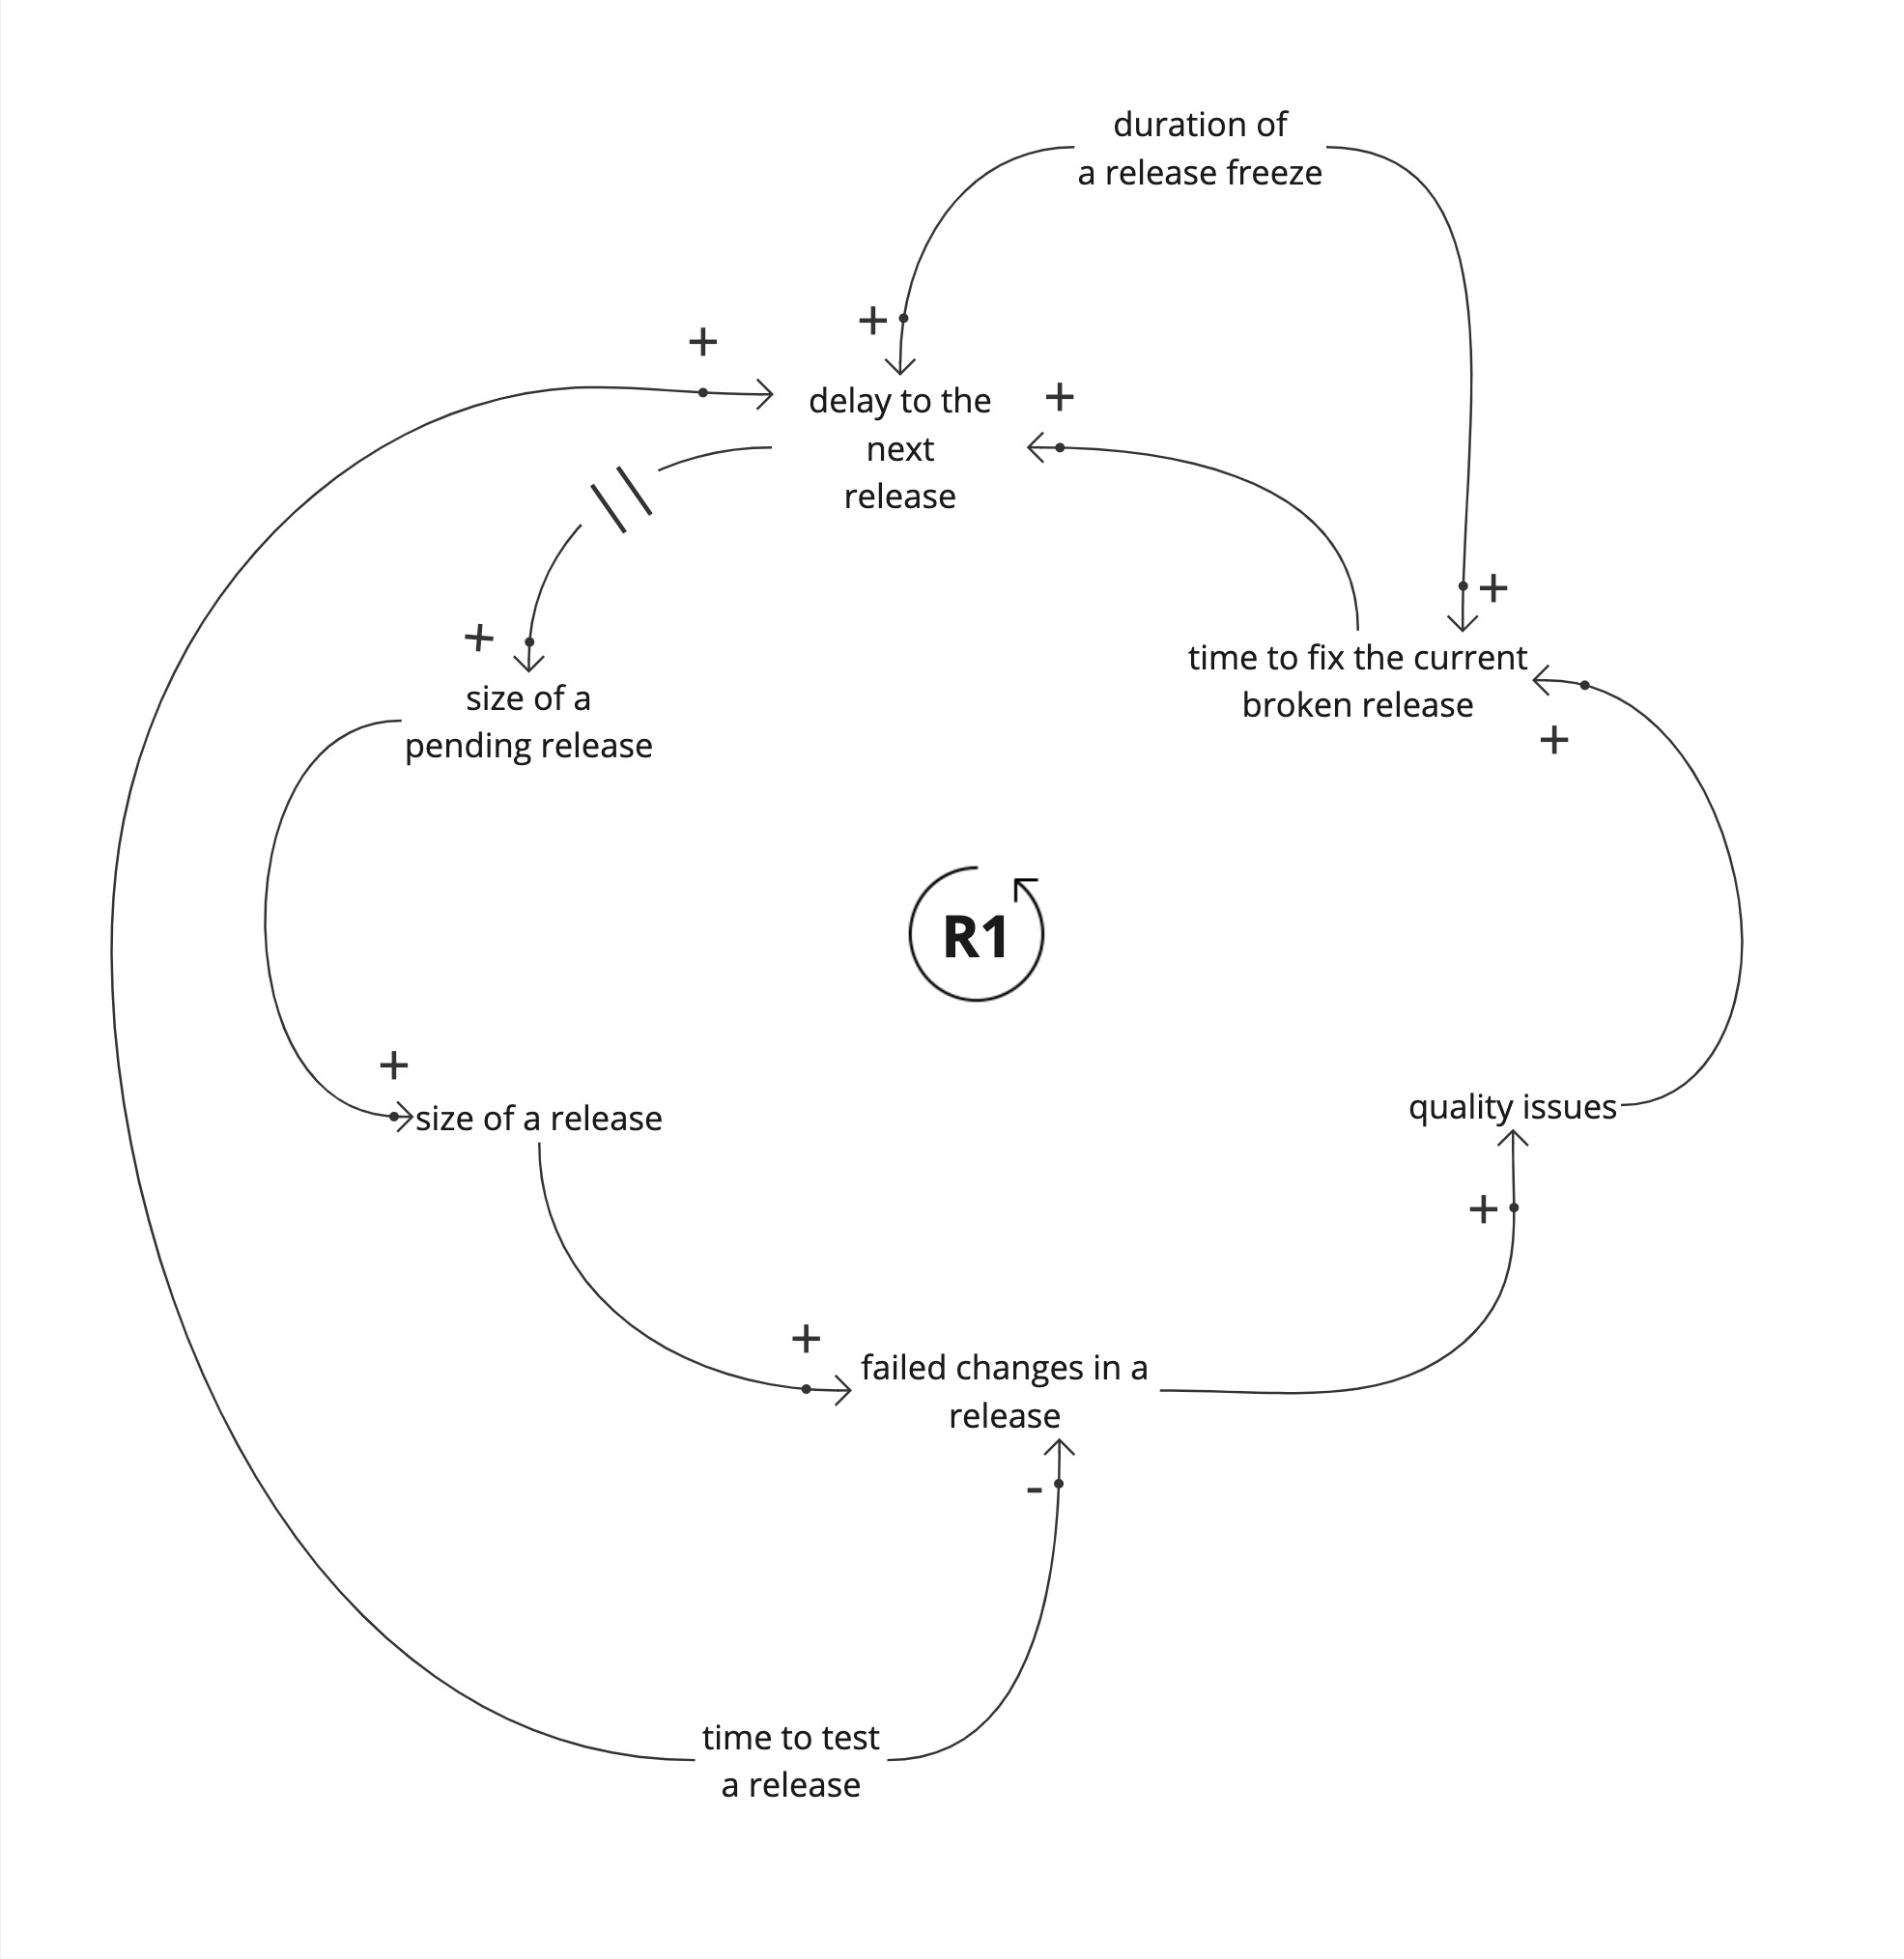
Lets look at another limiting factor, the release freeze. A release freeze buys us time to fix the current release.

Again, this increases the delay to the next release, and the changes pile up. Even if we temporarily fix the current release, release freezes reduce product quality.
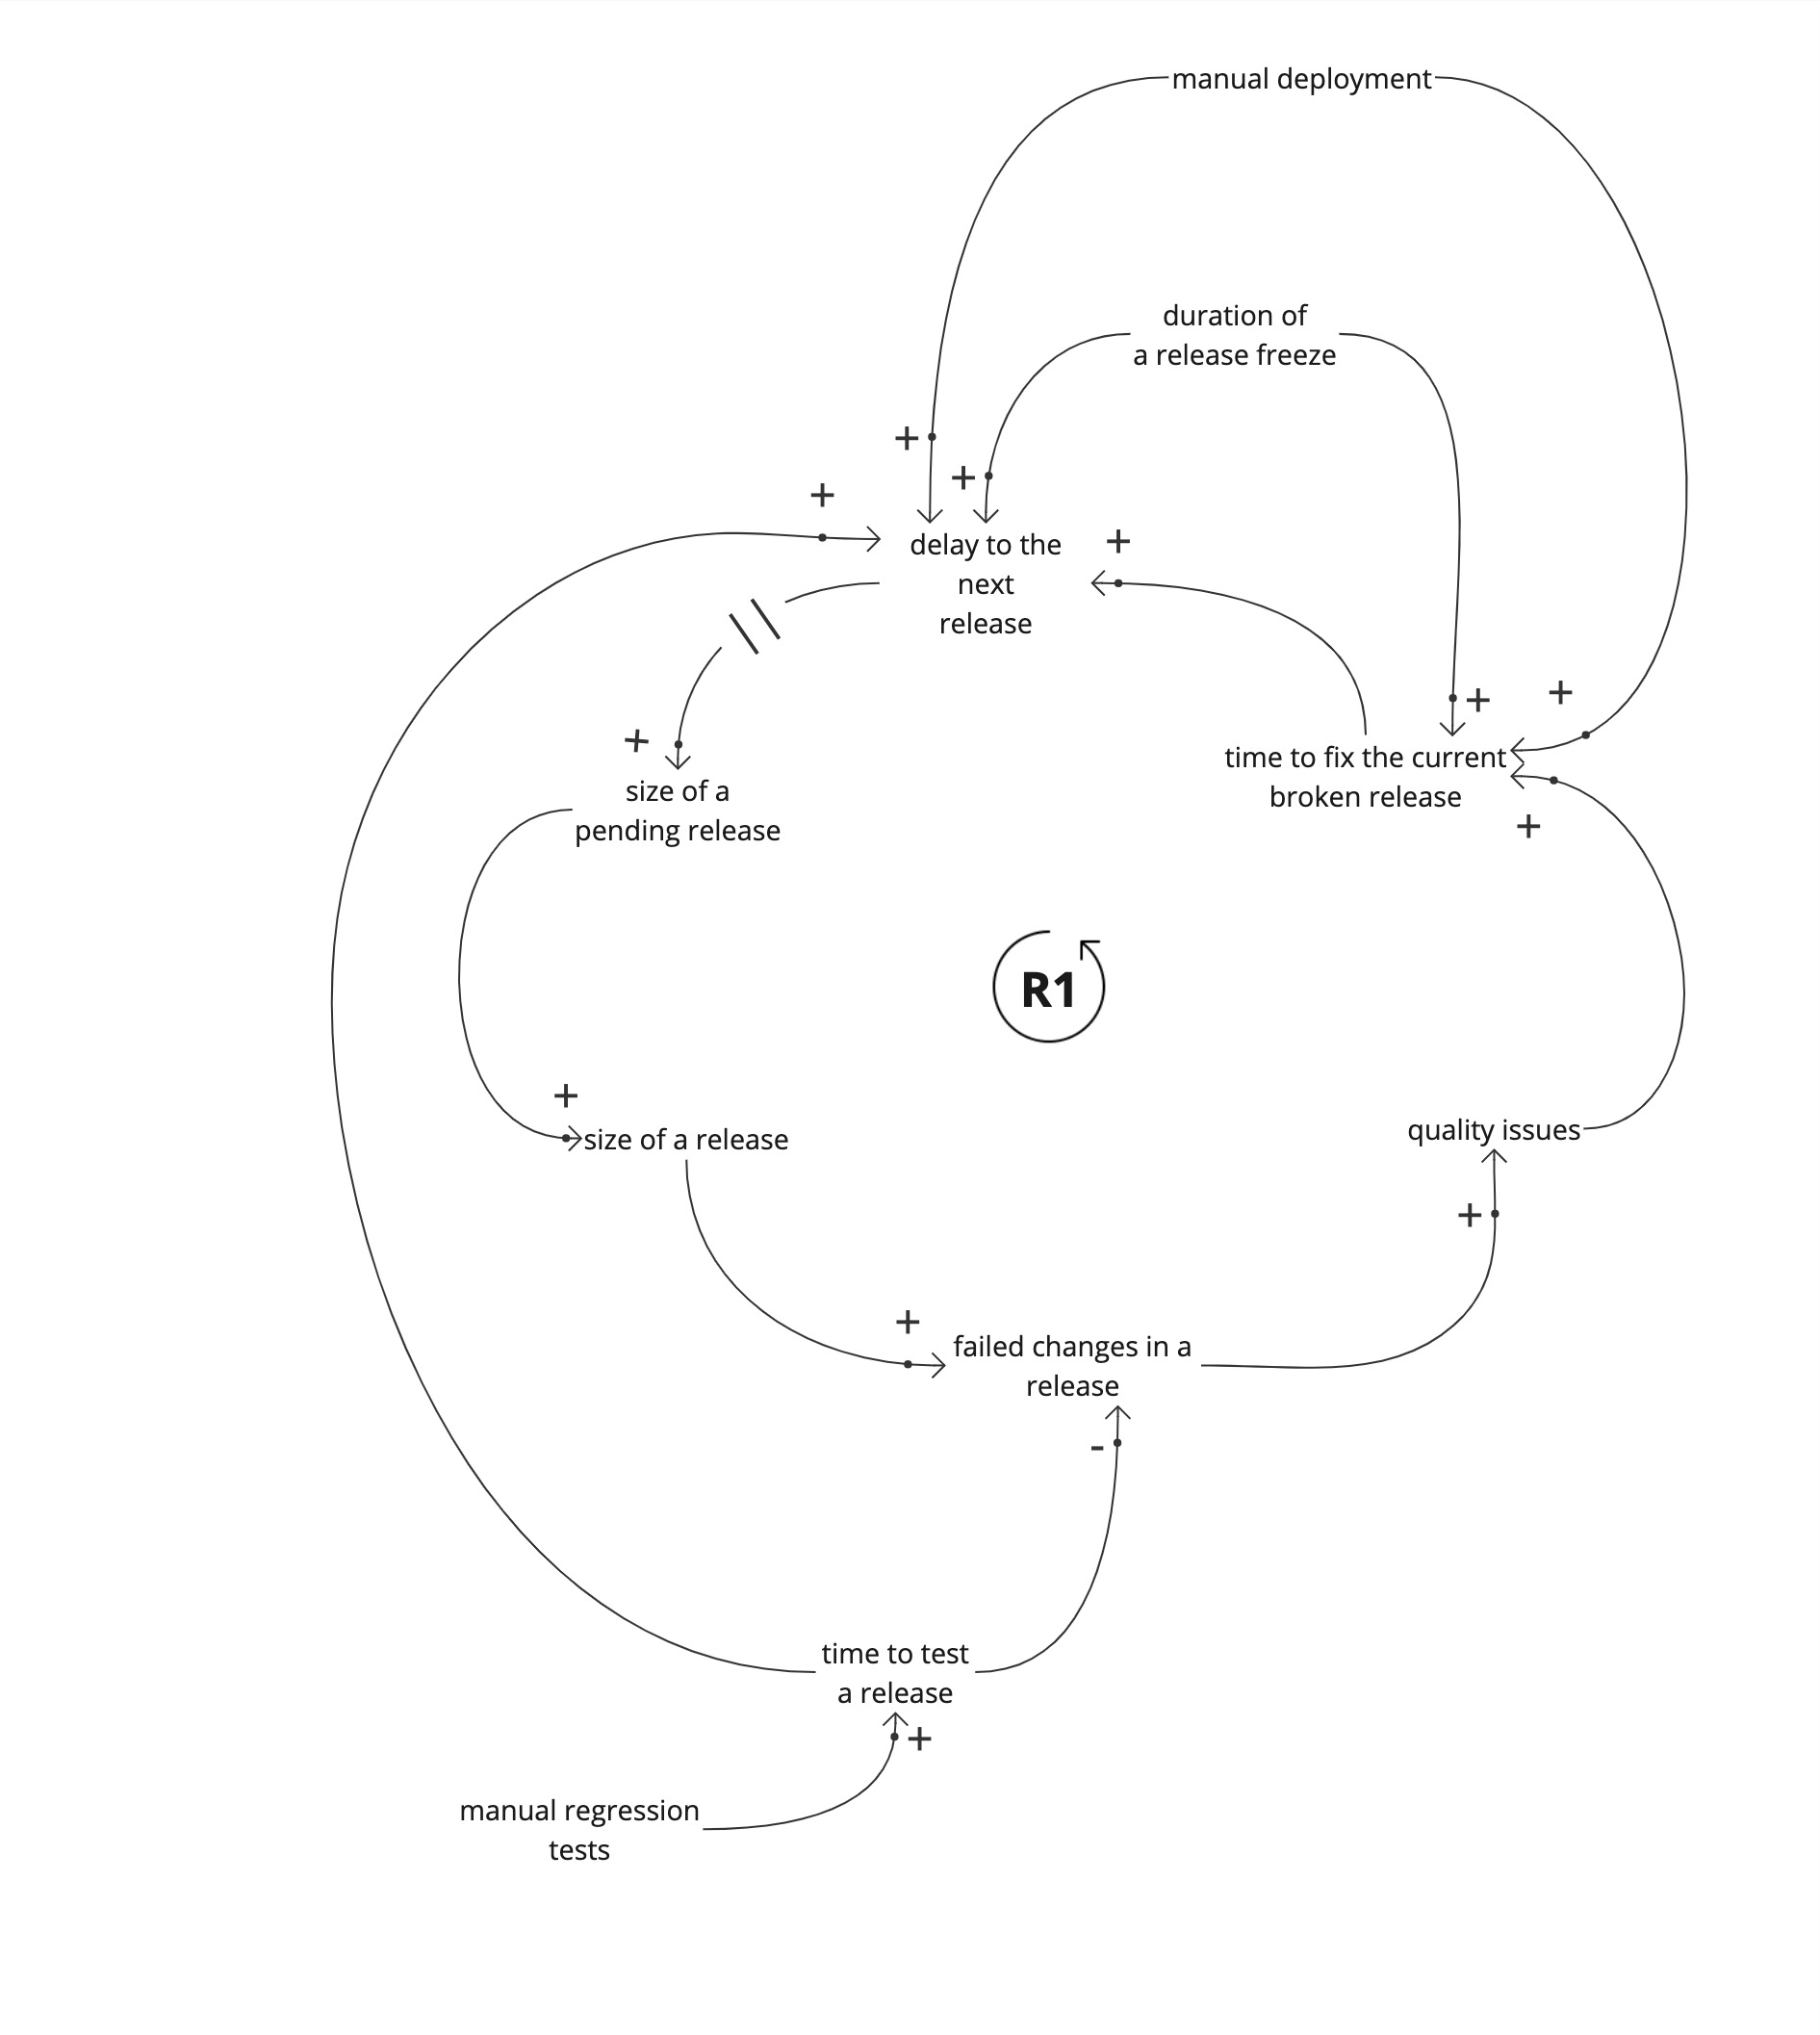
Lets look at other contributing factors adding to delays between releases.

Manual deployments and manual regression tests add to the delays between releases. This is sometimes obvious, but their relationship to the size of a pending change set is not always obvious.
Identifying leverage points
How do we get out of the vicious cycle? What leverage points to we have? In a vicious cycle, reducing any variable, reduces effect of that variable to the next.
Our leverage points are found by looking at what would contribute to reducing the effect of a variable in the vicious cycle.
Now that we have our casual loop model, we can look at what happens if we increase the deployment frequency.
Increasing the deployment frequency reduces the delay to the next release. We release what we have. But we can’t increase the deployment frequency because, if we can we would have done so.
There are variables that limit us from increasing the deployment frequency, such as the time taken to run manual regression testing steps, and the time taken to do manual deployments.
Reducing the delay, decreases the size of a release, reducing the probability of failed changes. Even if there are failed changes, the time to fix broken changes in a smaller release is less, in comparison with a larger release.
This in turn reduces the delay to the next release and improves quality.
Now that we know the variable we need to change, and which variables contribute to it, we can look at interventions.
Manual deployments are a contributing factor to the delay between releases. Automating deployments reduces the amount of manual work, and contributes to reducing the delay between releases.
Manual regression tests are a contributing factor to the delay between releases. Automating regression tests, reduces the time taken to test a release, contributes to reducing the delay between releases.
Move fast to fix things
We can see how increasing deployment frequency improves quality using a causal loop diagram. Mapping our system allows us to see our system and the “engine” that drives worsening product quality (or what makes it better).
System Dynamics and Causal Loop diagrams allow us to explore counter intuitive concepts, that can’t be explained with a linear model. We can find the leverage points in our system that create lasting change, instead of temporary band-aids, like release freezes or increasing time for manual regression testing.
05 Oct 2022
Cloud Development Kits (CDKs) allow you to use a familiar programming language to build Cloud Resources. This means that you can stay in the same IDE and use a familiar syntax to write the code that will run your code.
You don’t have to switch context between different tooling ecosystems. It helps you stay focused.
I use C# as my primary programming language (with Go a close second) and I do a lot of work with Cloud infrastructure. When I work with Terraform, I miss the type safety that a compiled language brings. I miss my refactoring tools to rename, move and safely delete things.
An IDE with a good set of refactoring tools reduces the cost of making code easier to work with.
The main reason by far for using a “proper” language for infrastructure is that I can express infrastructure in a contextual DSL. I’ve written about opinionated Terraform modules and code smells in Terraform. A CDK allows me to do is to have more flexibility in building an opinionated DSL.
By using a CDK, I don’t need to worry about modules. I can work with objects and express re-usability and modularisation with a flexible vocabulary, that I’m familiar with.
Let’s have a look at how this is possible, by looking at a simple example of building the resources necessary for an Azure Function. I’ll be using .Net Core and C# for this example.
Getting started
Getting started with the CDK for Terraform is easy. I won’t delve into the details of setup too much.
You’ll need NPM to get the CDK. The guide to installing the CDK is here
After initialising a new project, I’m good to go. The default project gives me a file to edit. I’m using local state storage for this example.
I use Jetbrains Rider as my IDE.
The first pass
This is my initial attempt to create the resources for the Azure Function app.
This is a simple stack, and I can deploy it via the CLI, after building the project.
I can rely on the compiler to catch any typos that screw up my dependencies. I don’t have to rely on ‘terraform validate’ anymore.
The good thing about using the CDK is that I don’t have to worry about the authentication details. I’ve logged in using the Azure CLI, and as with Terraform, the CDK takes care of the Azure authentication. If I were to use the ARM .Net SDK, I’d have to handle the authentication concerns myself.
There are a few things I don’t like;
- The need to give an id. I know this maps to the resource id in Terraform, but is this needed? Can this be autogenerated? I can see that this is important for backward compatibility to work with the existing state
- The need to pass in the string values of dependencies. Why do I have to pass in the name and the location of the resource group, instead of passing in one resource group object?
- The need to pass in a config object for each resource. I’d assume each resource will be an object by itself
However, I’m ok with this. I can refactor it, as this initial attempt looks a lot like HCL.
Next, I extract methods for each resource, into BuildXXX methods.
After extracting methods the orchestration is clear. The dependencies to build the function app in Azure are visible.
I use the steps in the excellent book Refactoring to Patterns.
I’ve been running ‘cdktf deploy’ with each refactoring step to make sure the plan doesn’t change.
Using the Builder Pattern
I’m using the Builder Pattern to make sure my Azure Function app resource is built the right way. This is where we can encapsulate ‘opinions’ on how to build the function app, for the domain I’m working in.
If I want to ensure I always want a Linux function app, I can encapsulate that inside the builder.
I start with a Builder for the Azure Function App, because that’s the core resource I want to build. The other resources are dependencies.
I move the BuildXXX methods for each resource, into their own classes.
Let’s take a look at the FunctionBuilder.
I’ve used the methods WithName(), InResourceGroup() and UsingAppServicePlan() to expose configuration that I want the caller to change. Everything else is encapsulated inside the Build() method.
Now my application stack looks like this;
I’ve created builders for the other resources and have a nice set of fluent builders to create my resources.
The dependencies between resources are clear. I can wire up the dependencies with object references. I can hide the complexities of creating a Config object for each resource, and I don’t have to care about resource identifiers because the builder takes care of it.
Next steps?
I could go further and put the builders in a Nuget package and distribute it to the rest of my team (or organisation), and use established versioning practices to share re-usable functionality.
The advantage CDK-TF has over HCL when refactoring is that the plan doesn’t change, something that I’ve found that happens when changing the structure of Terraform in the past.
You don’t have to use the Builder pattern. I’ve used the pattern to demonstrate the flexibility that the CDK brings to the table to create a DSL that works for you. I’ve been able to do all the refactoring with Rider and the compiler makes sure that nothing is broken too much.
20 Jul 2022
Infrastructure as Code has code smells (its code too !!) and as we work more with it, it’s important to be aware of code smells that indicate a deeper problem.
The Middleman doesn’t do anything other than delegate to a native resource
Let’s look at an example;
module storage_account {

	source = "./module/resource-group"

	name = var.storage_account_name

	resource_group_name = var.resource_group_name

	location = var.location

	account_tier = var.account_tier

	account_replication_type = var.account_replication_type

	tags = {

		environment = "staging"

	}

}
Here we see a module that creates a storage account. Let’s look inside the module itself.
resource "azurerm_storage_account" "storage_account" {

	name = var.storage_account_name

	resource_group_name = var.resource_group_name

	location = var.location

	account_tier = var.account_tier

	account_replication_type = var.account_replication_type

	tags = var.tags

}
The module has a single resource. The variables are delegated to the resource. There are no collaborating resources inside the module.
Why is this a code smell?
The module itself does not add any value over using the native resource directly, and is a thin wrapper around the single resource. A Terraform module is a group of resources that work together cohesively.
This code smell appears because of the need to control what types of resources are used in the organisation’s context. We can use Azure Policy and AWS Guardrails to achieve the same result
Another reason is the need to deploy resources consistently across the organisation. For example, to apply tags consistently. Again we can use policies to enforce consistent rules.
Does it satisfy the five CUPID properties?
- Unix philosophy: Does it do one thing well? it does, but all it does is delegate. The work is done by the resource that is wrapped in the module
- Predictable: Does it do what you expect? It’s unclear why a module is used than using the resource directly
- Idiomatic: Does it feel natural? It introduces an extra level of in-direction compared to using the resource directly
- Domain-based: does the solution model the problem domain? The module doesn’t model the domain, it duplicates what Terraform does
Treatment
Avoid wrapping single resources with modules. Terraform modules are composed of resources that work together to provide a cohesive building block. Get rid of the middleman.
01 Jul 2022
Infrastructure as Code has code smells (its code too !!) and as we work more with it, it’s important to be aware of code smells that indicate a deeper problem.
A Confused Terraform module has parameters, that change the behaviour of the module. Different parameter value combinations allow the behaviour to change. The module is confused about its identity.
Let’s look at an example;
This is an example of a module that creates a VPC. The module declaration has parameters that change its behaviour. There is the option for the VPC to allow egress outside the network, and the option to turn monitoring on or off.
This is a simple example, but modules tend to have long lists of parameters, with switches that change the module’s behaviour. A consumer of the module has to specify the right combination of switches for the behaviour they want.

Why is this a code smell?
The default behaviour of the module isn’t clear, without reading the documentation (or the code for the module). It’s easy to accidentally allow egress and deploy the VPC to an insecure state. If allowing egress implies that monitoring is turned on (to make sure that traffic that goes out of the network is monitored), the optional ‘enable_monitoring’ flag needs to be set. The onus is on the consumer of the module to ensure that the VPC is deployed in a compliant state.
The switches in the parameter list proliferate into the code, and each time we add a new capability we have to guard against breaking existing capabilities.
Does it satisfy the five CUPID properties?
- Unix philosophy: Does it do one thing well? The module has multiple behaviour depending on the combination of switches
- Predictable: Does it do what you expect? It’s easy to accidentally deploy the module in a non-compliant state
- Domain-based: does the solution model the problem domain? It’s not clear what this module offers over a the out of the box aws vpc resource
Treatment
Create modules that encapsulate the behaviour rather than make it optional.
For example;
In the example, we’ve created a module that is explicit about its behaviour. A consumer of the module is clear about what it does and doesn’t have a choice of turning monitoring on or off. There isn’t the option to deploy the module to an insecure state.
Each module now does one thing well, and it’s behaviour is predictable. The name of the module describes the behaviour in the context that it’s being used.
Both modules can now evolve without having to worry about breaking the functionality of the other.
16 Apr 2021
An anti-pattern I’ve seen in security-conscious organisations is, access to the Public Cloud provider’s console is restricted in development environments. In a recent project I worked on, developers did not have access to the Azure portal to view, debug and test changes in a non-production environment. The restricted access impeded the developer experience (DevEx), negating the Public Cloud’s productivity benefits.
Let’s look at how we can safely improve the developer workflow and mitigate the risks associated with giving developers more autonomy.
The problem - restricted developer experience
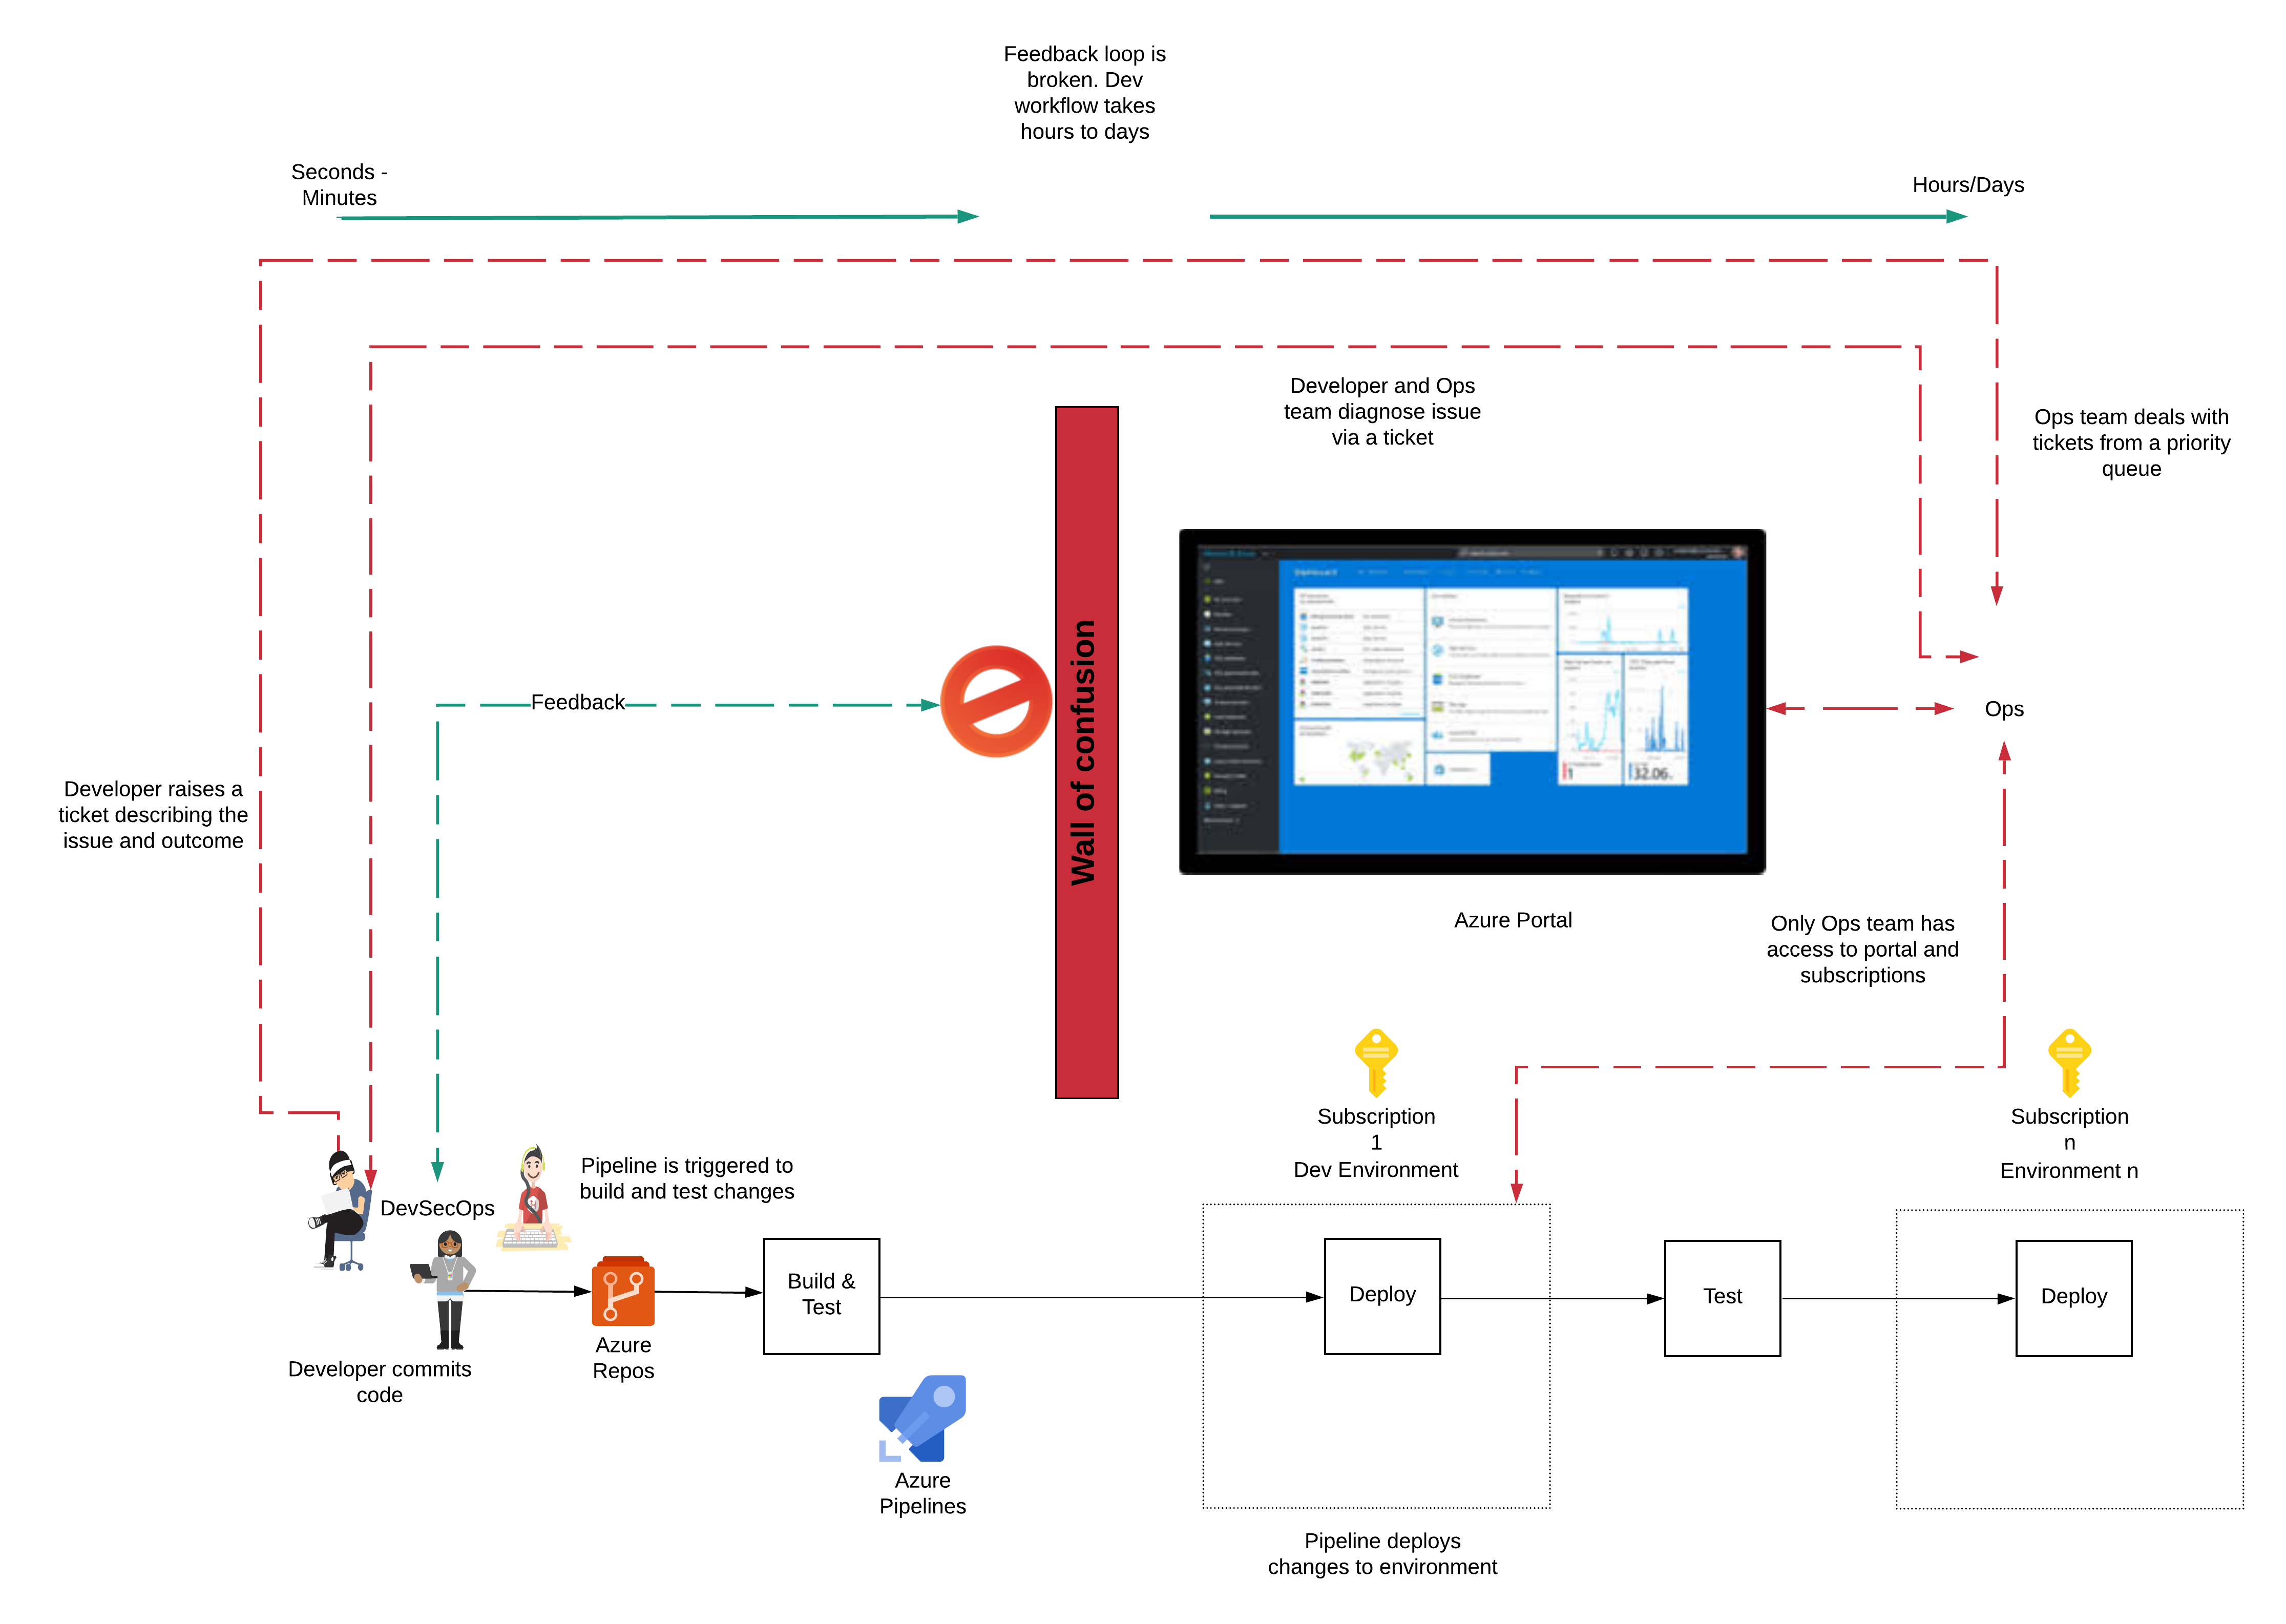
Access to the portal was given only to the Ops team. The team did not have access to the Azure subscription through the Azure portal to verify changes or debug problems. The team had to engage the Ops team to look at the problem, usually via raising a ticket and then explaining the problem and waiting for a response.
This mode of working is a DevOps anti-pattern. A developer should have the freedom to resolve their issues without having to depend on another team.
The handoff creates a significant delay in the development workflow. It increases the development cycle from minutes to hours and days. The long debugging cycle and handoffs incur costs on both the development team and the Ops team.
The developer is blocked, and the wait-time increases development costs. An Ops team member has to be interrupted to un-block a developer. Resources are diverted from making platform improvements, creating a negative loop. I call this the Wall of Confusion.

What should an ideal developer experience look like?
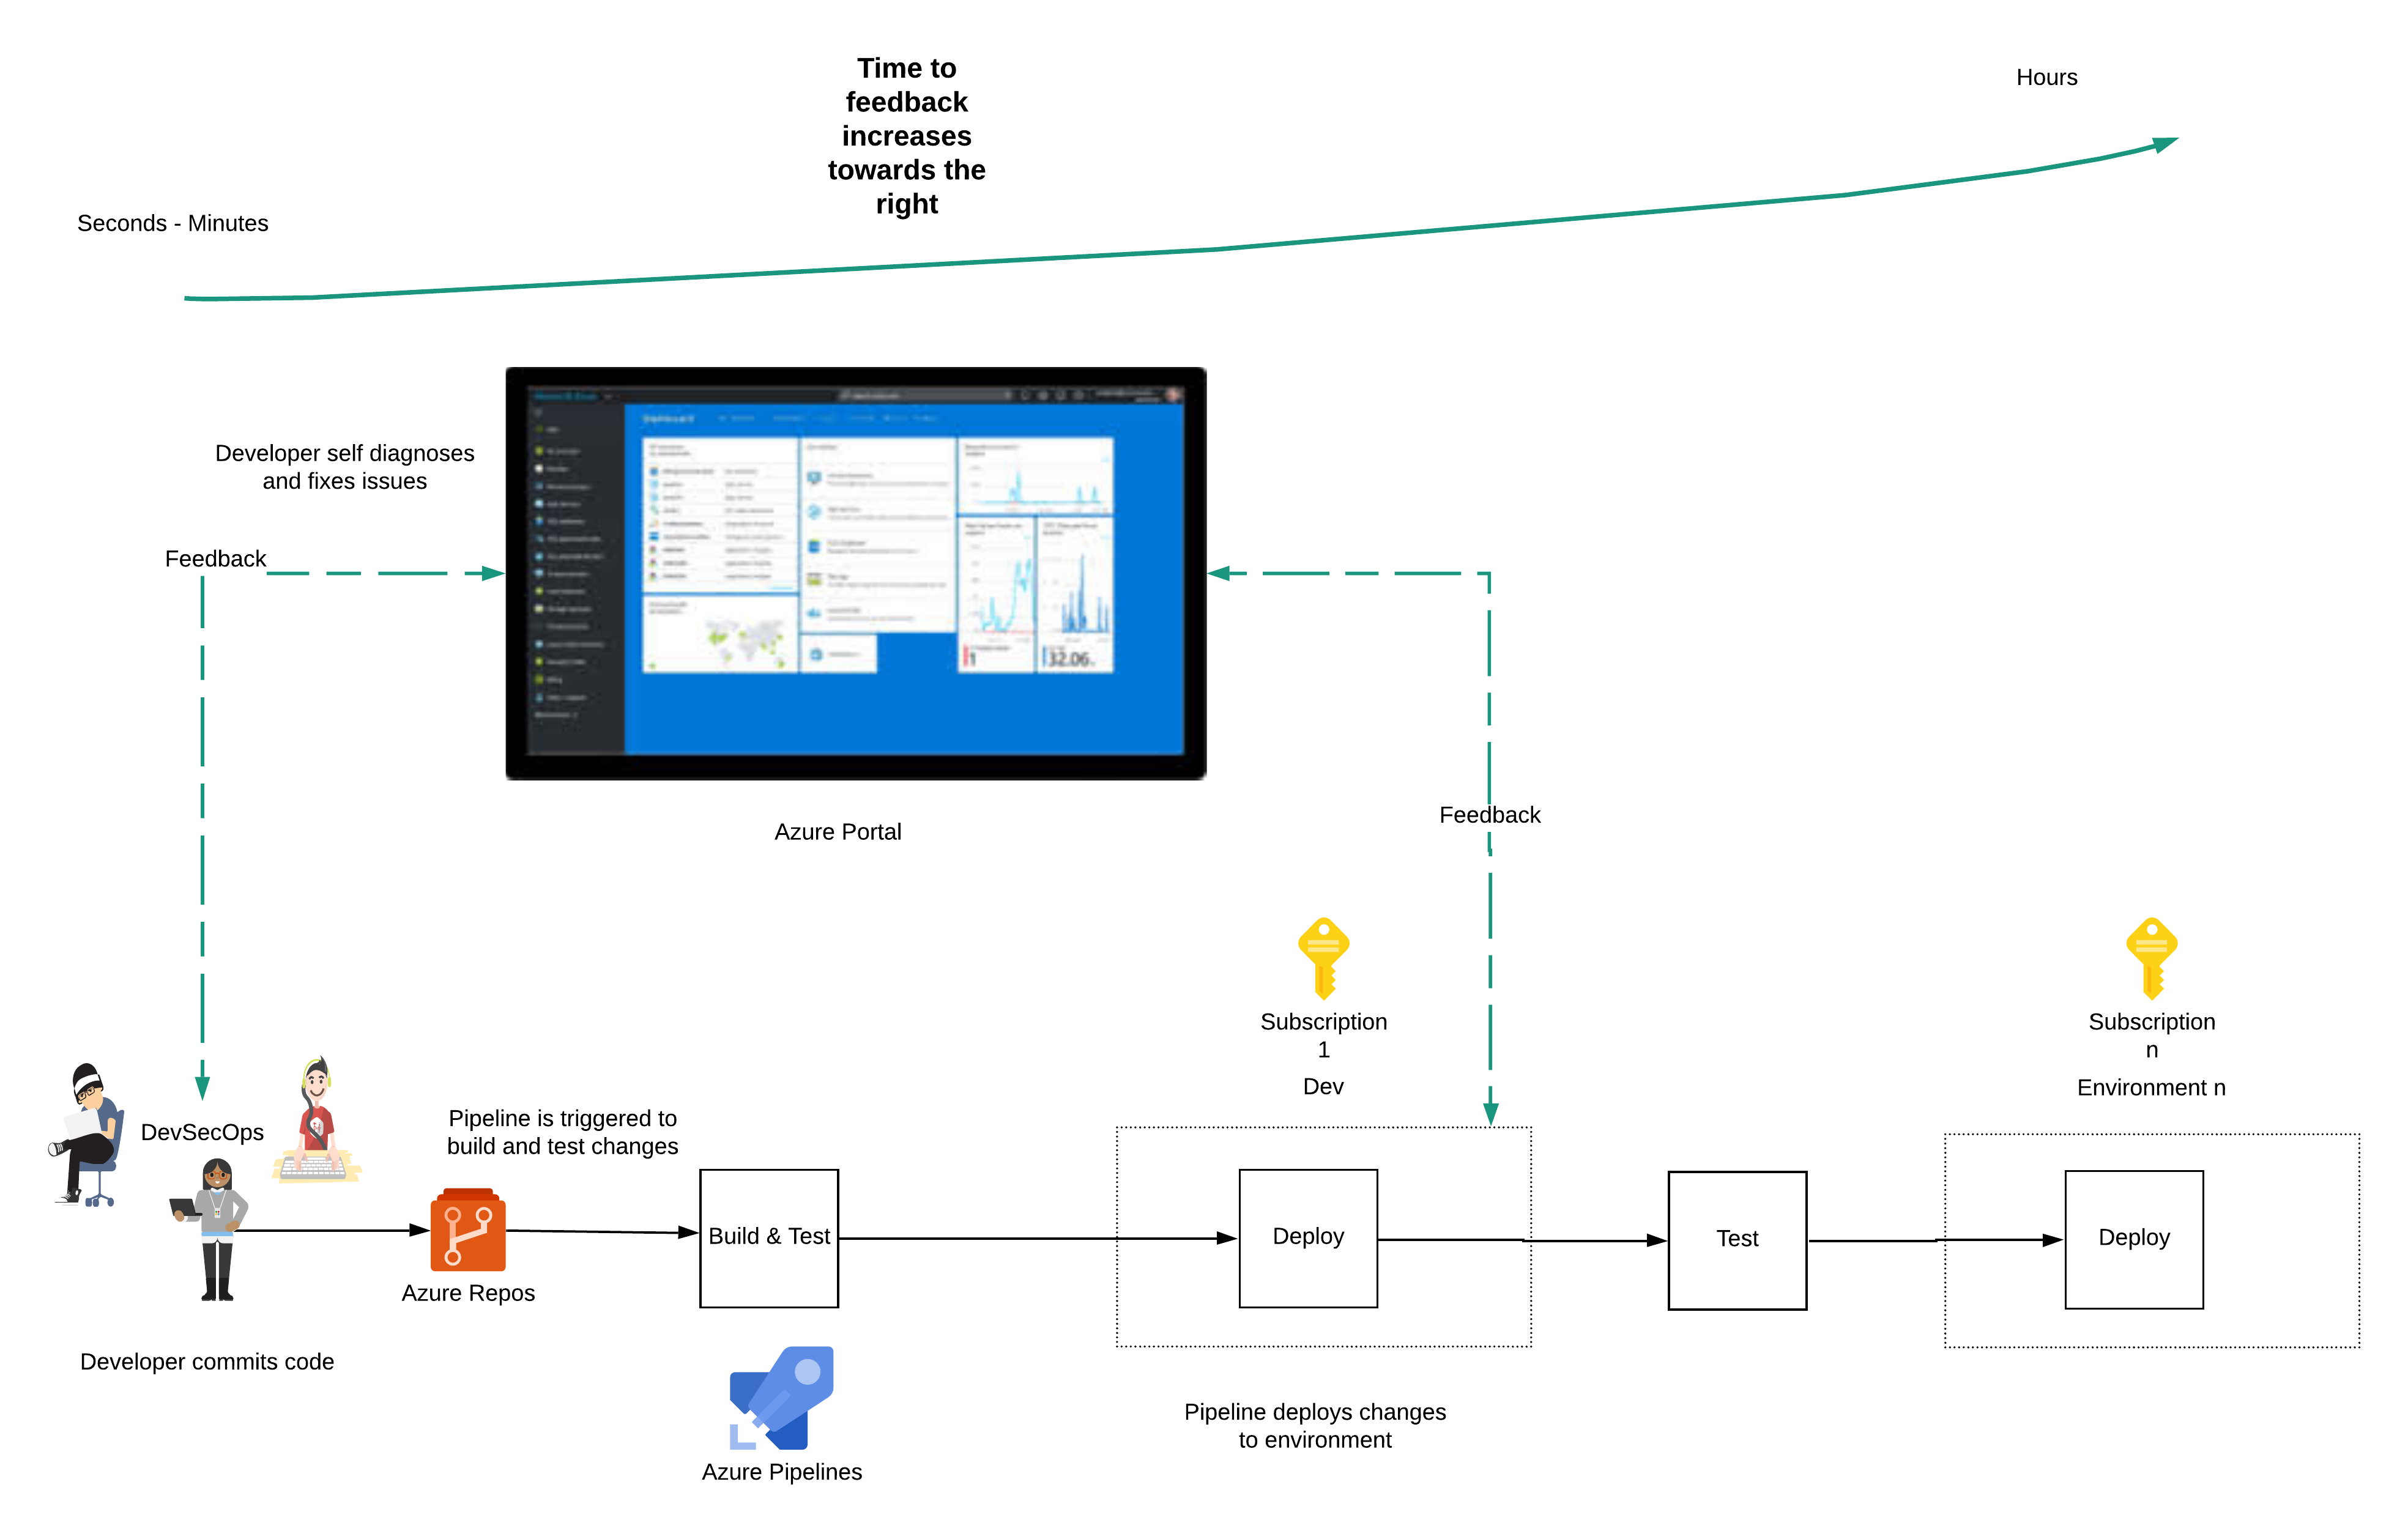
The developer writes infrastructure as code (IaC) to create and configure Azure. The developer checks in code and tests to source control. The code commit triggers a pipeline, which runs the IaC to make the intended changes first in the development (Dev) environment.
The pipeline then executes the tests automatically to test for regression and that the new functionality works. When the tests pass (the build is green), the changes are propagated to the following environment.

In the Dev environment, a developer will need to eyeball the changes made to Azure resources to verify that the resources were created and configured as expected.
A successful run of the pipeline may not always indicate a successful deployment.
If a test fails, the developer will need to use the Azure portal to check the state of resources related to the failure. The developer should also have access to manually create new resources to test the latest changes before applying the fix to code and committing the change to source control, which triggers the pipeline.
The developer goes through the development workflow described above many times (minimum of 50 to 100 times) a day and runs through the whole workflow in minutes. The quality of the system is improved when the developer has a fast feedback loop.
The impact of a poor developer experience
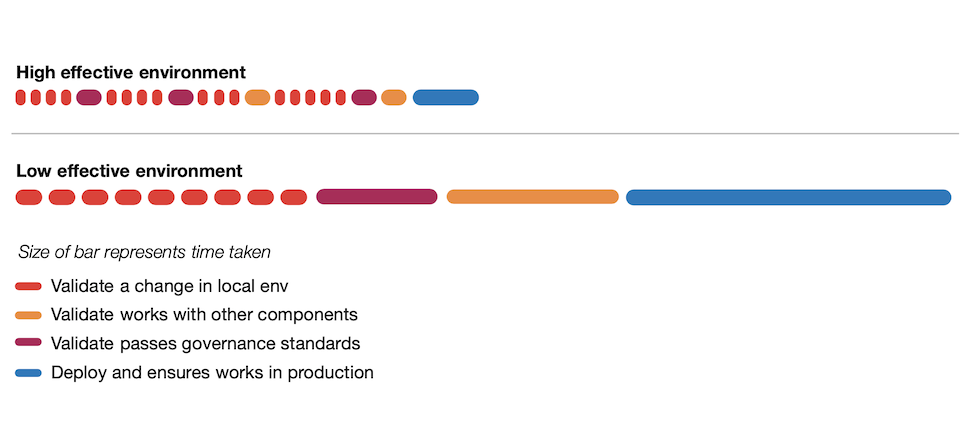
Cochran (2021) shows a simple representation of how developers use feedback loops and a comparison of the time taken for developer activities in the restricted (low-effective) environment and un-restricted (high-effective) environment.

The important observations are;
- Developers will run the feedback loops more often if they are shorter
- Developers will run tests and builds more often and take action on the result if they are seen as valuable to the developer and not purely bureaucratic overhead
- Getting validation earlier and more often reduces the rework later on
- Feedback loops that are simple to interpret results, reduce back and forth communications and cognitive overhead
How to improve the developer experience safely?
So how do we improve the developer experience whilst keeping production data and sensitive configuration secure?
We need to start with some. Restrictions.
Developers will only have permissions to view, manage and debug resources via the Azure Portal in lower environments such as Dev and Test.
Developers will only have read-only access in higher environments, such as Pre-Prod and Prod, for the following;
- Monitor application health and alerts
- View resource costs and budget limits
- Error messages and logs
Developers will be not be given permissions to view the following in higher environments;
- Sensitive configuration settings
- Data in databases
- Key vault secrets
- Logs with sensitive data
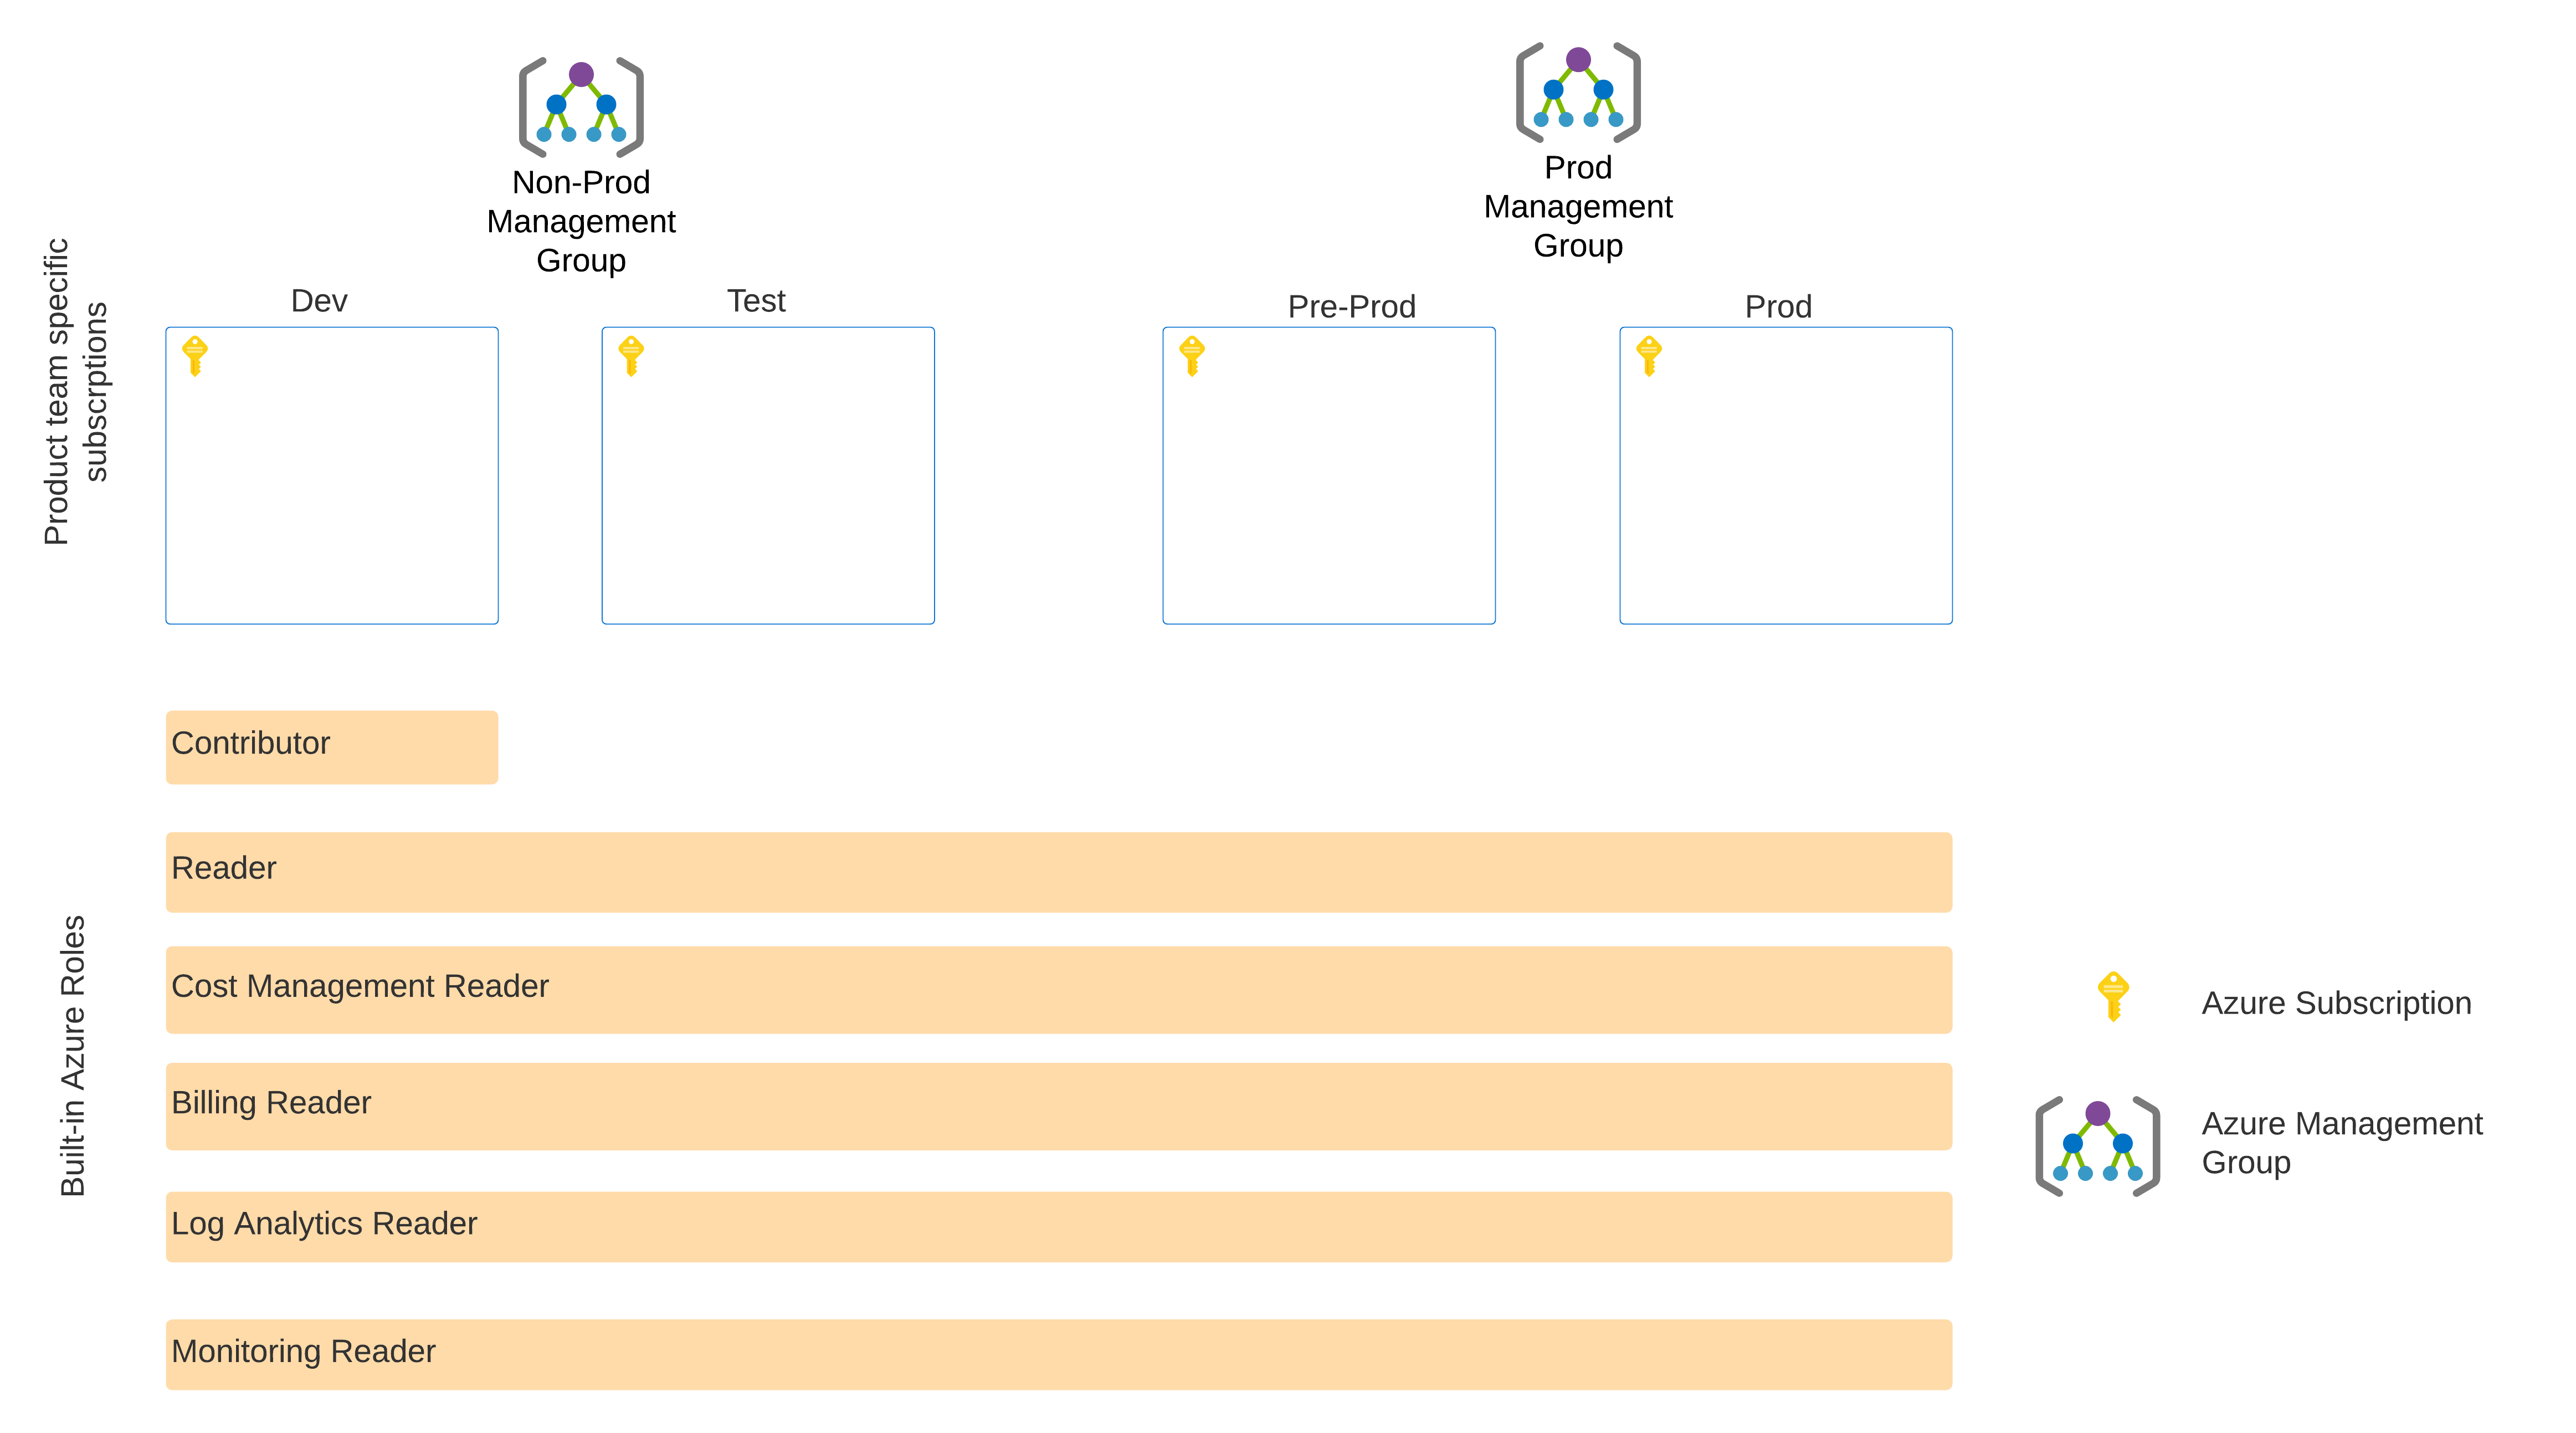
We leverage Role-Based Access Control (RBAC) to manage access. Here’s an example using Azure’s built-in roles.

The built-in Azure roles, which will be assigned to the user group that the developer is in. It’s expected that the RBAC assignments will be at the management group level and not at the subscription level.
To make this work, subscriptions are associated with product team-specific Azure management groups to ensure proper configuration and control of subscriptions.
The only path to a Production environment will be via pipelines in Azure DevOps, using code from source control. Changes made via the portal will not be propagated to higher environments and can be overwritten on the next pipeline run.
Mitigating the risks associated with the approach
There are common arguments against the approach described above and the risks associated with it. However, there are effective mitigations.
- A developer can accidentally destroy resources belonging to other teams. We mitigate this risk by scoping Contributor access only to the product team-specific Azure development subscription, and mistakes are not propagated to other teams. The team should be able to re-create resources from source control.
- Shared platform components can be deleted. Again, this risk is mitigated by having dedicated subscriptions for shared platform components. Only the teams responsible for those components have access.
- A developer can accidentally expose data to the Internet. We mitigate this risk by having guardrails using Azure Policy, which are applied at the management group level. The policy prohibits the creation of resources that will allow data egress to the Internet. We allow ingress and egress to only via shared services, which have the appropriate governance built into them. There should also be no live data in a development environment.
- Developers will be able to modify production infrastructure. Azure Portal access in higher environments is read-only and restricted to observability. Temporary break-glass access to Prod is catered to through Azure Privileged Identity Management.
- Costs could increase if developers can create resources. Subscriptions are assigned to product teams, who will own the cost of running the subscription. When developers have access to the billing dashboard, they can self manage expenses. The cost of lost developer productivity is often greater than the cost of infrastructure.
What do we get when we unblock the developer experience?
Adopting the approach has positive benefits, even though managing RBAC at scale requires extensive automation.
- The developer experience is positive and creates a high effective environment. A highly effective environment is where there is a feeling of momentum; everything is easy and efficient, and developers encounter little friction
- Product teams can launch new services quickly
- The developer can observe the application in a production environment, creating a feedback loop that reinforces a positive culture
- The developer can take advantage of existing Azure knowledge and familiarity with the Azure Portal to diagnose problems independently
References
Cochran, T. (2021) Maximizing Developer Effectiveness. Available at: https://martinfowler.com/articles/developer-effectiveness.html (Accessed: January 11, 2021)
